Home›Resources›ESG data management system
How to Build an ESG Data Management System
Every company already generates ESG data. It sits in production logs, HR software, utility invoices, and procurement records. The question is not whether the data exists, but whether it is organised.
Where your ESG data already lives
An ESG data management system does not create data. It retrieves data that already exists in the company's operating software and organises it into a structured format.
Most SMEs have at least six types of system that hold ESG-relevant information:
- Production and operations software records energy consumption, machine uptime, and operational data.
- Procurement software tracks purchased goods and services, including spend with suppliers.
- HR software holds headcount, contracts, working conditions, and pay data.
- Health and Safety systems record incidents, near-misses, training completion, and compliance records.
- Internal audit software captures governance processes, compliance checks, and findings.
- Finance and accounting software holds cost data, revenue by activity, and financial provisions.
The data does not need to be moved or rebuilt. It needs to be mapped, extracted on a regular cycle, and translated into the standard indicators the reporting framework requires.
How data flows into an ESG system
The transfer of data from existing systems into an ESG platform can happen in two ways: manually or through automated integration.
Manual migration means a person extracts data from each system on a defined schedule, typically monthly or quarterly, and enters it into the ESG tool. This is how most SMEs start. The workload is manageable when the number of indicators is limited and the reporting cycle is annual.
Automated integration connects source systems directly to the ESG platform through an API or file export. The data arrives on a fixed schedule without manual input. This makes sense once the system is stable and reporting frequency increases.
In either case, different departments contribute. Operations supplies energy and production data. Procurement manages supplier spend records. HR provides workforce data. Health and Safety submits incident logs. Finance provides cost and revenue figures. Someone in the business owns the receiving and validation step: checking that the data arrived, is complete, and is correctly formatted before it enters the reporting layer.
The EU VSME standard provides the indicator list, each one with a unit, a definition, and a collection methodology. Building the system around that framework means the data collected today will answer tomorrow's customer questionnaire without additional effort.
Once validated, the raw data is not yet an ESG indicator. It needs to be transformed. Energy consumption figures become a carbon footprint once multiplied by the right emission factor. Incident logs become a recordable work-related accident rate (accidents per hours worked), as VSME B9 requires. Total GHG emissions divided by turnover in euros give the GHG intensity ratio VSME B3 explicitly requires. The ESG system applies these calculations because it holds two things at once: the input data from company systems, and the definition of each indicator the reporting framework requires. That combination of data plus framework logic is what turns operational records into reportable sustainability performance.
What a structured ESG system produces
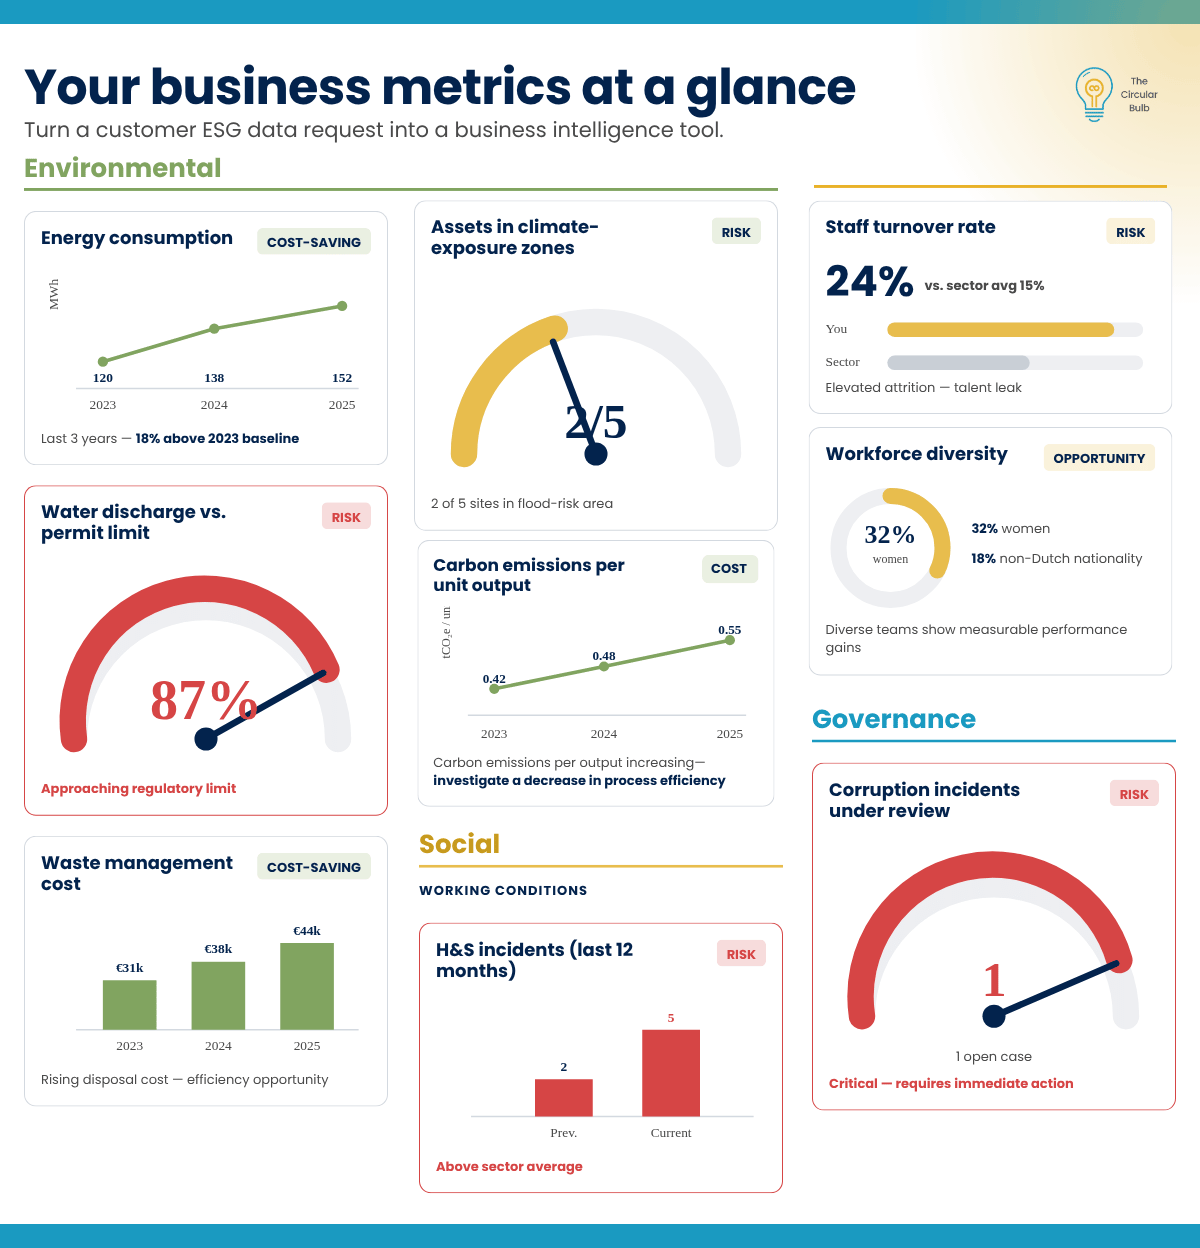
Once data is flowing into the system, the output is a set of dashboards and KPI panels. These are not abstract reports. They surface specific, measurable signals about how the business is operating.
Environmental
- Energy consumption tracked over three years reveals whether the business is becoming more or less efficient per unit of output.
- Water discharge measured against the permit limit shows proximity to a regulatory threshold.
- Waste management cost tracked annually identifies whether disposal costs are rising and where reduction opportunities exist.
- Carbon emissions per unit of output, if increasing over time, point to a decline in process efficiency.
- Assets in climate-exposure zones, mapped against site locations, flag physical risk from flood or heat.
Social
- Health and safety incidents logged over a rolling 12 months, compared with a sector average, show whether the company is above or below the norm.
- Staff turnover rate compared with a sector benchmark identifies talent retention risk.
- Workforce composition (gender breakdown and share of employees on permanent versus temporary contracts) is tracked under VSME B8 and is an increasingly common customer indicator.
Governance
- Corruption incidents under internal review: any open case at the time of reporting requires immediate response.
- Revenues from certain sectors feed customer exclusion screening and VSME disclosure requirements.
The indicators accounting books do not show
Financial accounts record what a business earns and what it spends. They do not record the conditions that determine whether those numbers hold.
A qualified and experienced workforce is the operating asset that delivers services and manufactures products. It is what converts inputs into revenue. Poor working conditions, whether related to wages, health and safety, or career development, create the conditions for talent to leave. When key people leave, that asset depreciates, and the revenue it was generating becomes harder to sustain. An ESG tracking system makes this visible. Staff turnover rate, recordable accident rate, and average training hours per employee are not soft indicators. They are measures of the durability of the human asset the business depends on.
Energy and materials consumption works the same way. Rising consumption puts direct pressure on operating costs. By tracking this data periodically, a company builds metrics for carbon emissions and resource use, but it also creates the conditions for early detection. When consumption rises unexpectedly, the system flags it. That signal prompts investigation, and investigation allows the underlying cause to be identified and resolved before it becomes a structural cost problem.
These patterns do not appear in a profit and loss statement. They appear in an ESG dashboard. The system does not replace financial reporting. It adds a layer of operational intelligence that financial reporting does not provide.
This is not about data that was previously invisible. Workforce data sits in HR software. Energy data sits in utility bills and production systems. H&S records sit with the safety manager. Each department sees its own piece. What an ESG system adds is a consolidated view: all indicators in one place, updated on the same cycle, accessible to management without requesting a report from each function. That consolidation is also what makes cross-indicator patterns visible: a rise in H&S incidents alongside a drop in training hours, or an energy spike that coincides with experienced operators leaving the company. Those connections exist in the data; they are just not visible when the data lives in separate systems.
Water discharge at 87% of permit limit. H&S incidents above sector average. Staff turnover 9 points above benchmark.
Waste management costs rising 18% over 3 years. Energy consumption trending up per unit of output.
Workforce diversity above sector average. Carbon emissions per unit lower than industry peers.
From system to questionnaire answer
When a large customer sends an ESG questionnaire, the supplier receiving it faces a choice. Respond reactively, gathering data under time pressure from scattered sources, and producing an answer of uncertain quality. Or respond from a system: pulling pre-structured, verified data that was already being tracked.
A supplier with a functioning ESG data management system can answer most standard questionnaires quickly and consistently. The data is already collected, and the indicators are already built around the standards the supplier reports under. Where a customer's framework calls for something different, that same data can be used to build new indicators against it. Whether the request comes from EcoVadis, the Carbon Disclosure Project, or a certification covering working conditions, the data engine already holds what the response needs.
The same system handles the next questionnaire from a different customer, and the one after that. The data infrastructure is built once. Each additional request draws from the same foundation without triggering a new data-gathering exercise. This is what separates a supplier that can respond from one that cannot.
Do you want to go a step further? An AI agent can pull that data automatically and fill in the customer's questionnaire.
Without a system
- Data scattered across departments
- Weeks to compile a response
- Answers inconsistent between requests
- Each questionnaire triggers a new effort
With a system
- Data pre-structured and verified
- Hours to produce a response
- Consistent answers across customers
- Each questionnaire draws from the same foundation
How to start building it
Building an ESG data management system does not require a dedicated platform from day one. The architecture can evolve in stages as the system matures and the data volume increases.
| Stage | Tool | What it covers |
|---|---|---|
| 1 | Spreadsheet (Excel or Google Sheets) | Manual data entry against a fixed indicator list. Sufficient for annual reporting to one or two customers. The EU VSME template defines the columns. |
| 2 | Simple database or structured template | Centralised data store with one person responsible for updates. Reduces copy-paste error. Works at quarterly reporting frequency. |
| 3 | Dedicated ESG software | Automated data feeds, audit trail, multiple-user access, integrated reporting. Justified when reporting frequency is high or the number of customers requiring data exceeds three or four. |
AI coding tools now let non-developers build lightweight data collection and processing tools without specialist software skills, lowering the barrier to moving from Stage 1 to Stage 2 considerably.
Five practical steps for the build:
- Map your systems. Identify where each ESG indicator lives today: which software, which department, which person.
- Choose how to centralise it. Start with a spreadsheet if volume is low. A simple database or ESG tool makes sense once the data set grows.
- Deploy data collection. Assign collection responsibilities by department. Define frequency. Designate the person who receives and validates the incoming data.
- Build dashboards. Turn raw indicators into panels that communicate a signal: trending, improving, at risk, below benchmark.
- Use the data commercially. A supplier that can answer a customer data request in hours, not weeks, occupies a different position in that customer's procurement process.
Has a customer already sent a data request?
Talk through where your business stands. Book a free 15-minute call. No agenda required.
Book a 15-minute call